SysGauge Pro and SysGauge Server provide the ability to monitor the Windows Active Directory services locally or via the network.
The SysGauge Active Directory monitor allows one to monitor the performance, health status, security and the replication status
of the Windows Active Directory services using tens of different monitoring counters.
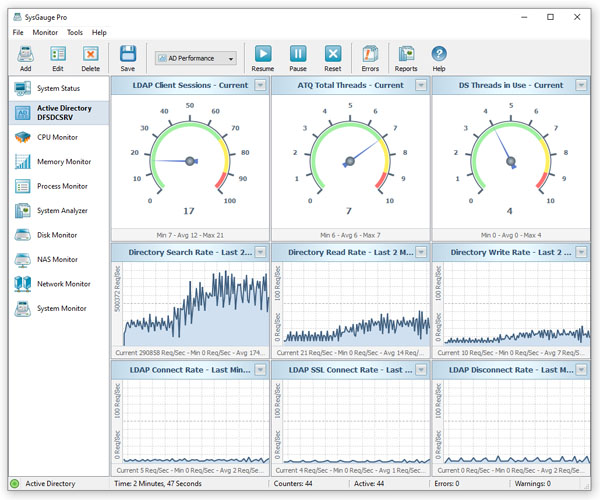
In order to add the Active Directory monitor, press the 'Add' button located in the top-left corner of the main SysGauge GUI
application and select the ‘Active Directory’ menu item. If the Active Directory server should be monitored via the network,
specify the remote server host name and add the user account running the SysGauge GUI application to the Performance Monitor
Users Group with permissions to monitor the target Windows domain controller server.
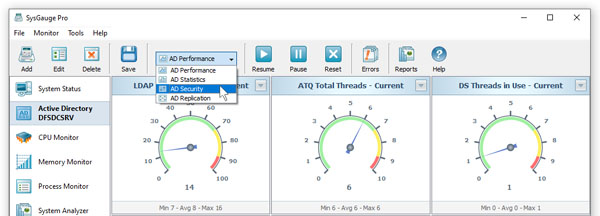
The SysGauge Active Directory monitor provides 4 different GUI layouts allowing one to monitor the performance, health status,
security and the replication status of the Active directory services. In order to change the currently displayed Active Directory
monitor GUI layout, use the layout selector located on the main toolbar.
The Active Directory performance monitoring GUI layout shows the number of LDAP clients sessions gauge, the total number of ATQ threads gauge,
the current number of DS threads gauge, the Active Directory search rate line chart, the Active Directory read rate line chart,
the Active Directory write rate chart, the LDAP connect rate line chart, the LDAP SSL connect rate line chart and the LDAP disconnect rate chart.
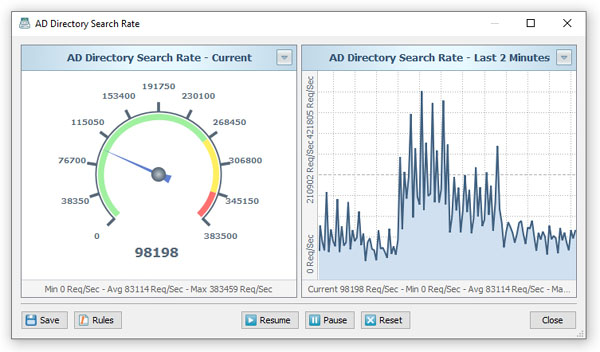
In order to see detailed information about a specific Active Directory monitoring counter, double-click on the counter in the SysGauge GUI application.
For example, in order to see more details about the Active Directory search rate, double-click on the search rate counter in the AD Performance
view and the SysGauge GUI application will open the Active Directory search rate counter dialog allowing one to save a monitoring report
for this specific monitoring counter and/or define user-specific limits for this specific monitoring counter and show errors or send
e-mail notifications if this specific counter rises above or drops below the user-specified limits.
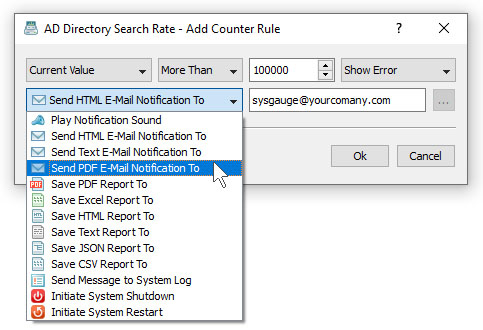
The user is provided with the ability to automatically execute a number of different types of actions depending on different values of the monitored counter.
For example, if an Active Directory monitoring counter indicates a sub-optimal operation, the conditional rule may just set the counter to display a warning
message and if a monitoring counter indicates a critical problem, the conditional rule may display a critical error message and send an error e-mail
notification to an IT administrator.
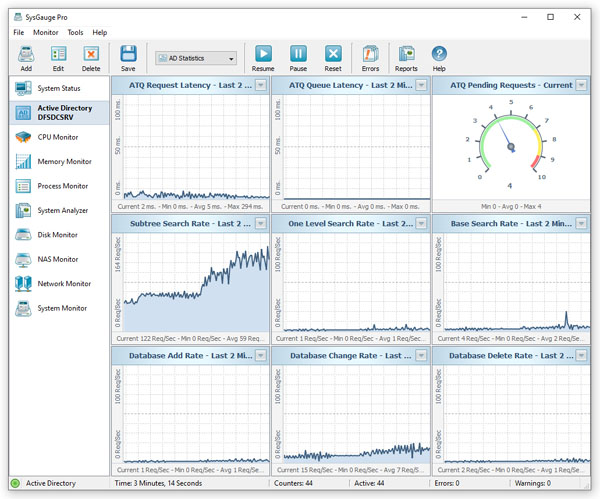
The Active Directory monitor 'Statistics' GUI layout shows the ATQ request latency, the ATQ queue latency, the number of pending ATQ requests,
the directory service sub tree search rate, the directory service one level search rate, the directory service base search rate, the Active Directory
database add rate, the Active Directory database change rate and the Active Directory database delete rate.
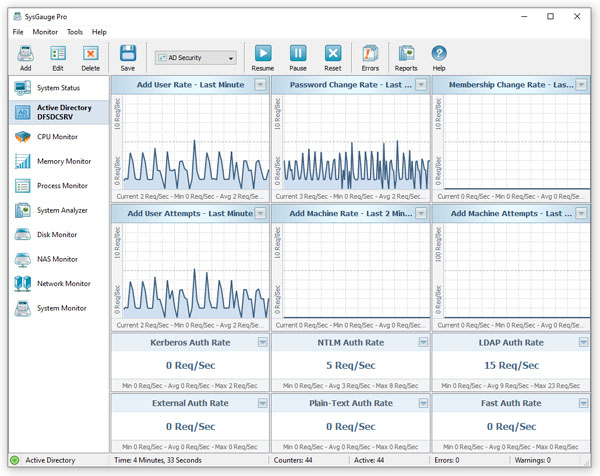
The Active Directory monitor 'Security' GUI layout shows the add user rate, the add user attempt rate, the password change rate, the membership change rate,
the add machine rate, the add machine attempt rate, the Kerberos authentication rate, the NTLM authentication rate, the LDAP authentication rate, the external
authentication rate, the plain-text authentication rate and the fast authentication rate.
Active Directory Monitoring Reports
SysGauge Pro and SysGauge Server provide the ability to save different types of Active Directory monitoring reports to a number of standard report formats
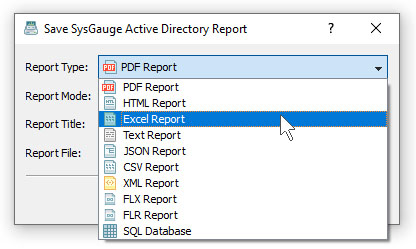
including PDF, HTML, Excel, CSV, JSON, text and XML. In order save an Active Directory report, press the ‘Save’ button located on the main toolbar
and select an appropriate report format.
For example, a SysGauge PDF Active Directory monitoring report includes a report summary showing the report date and time, the monitoring process time,
the monitoring report ID, the target host name, the user name, the number of monitoring counters and the number of monitoring errors.
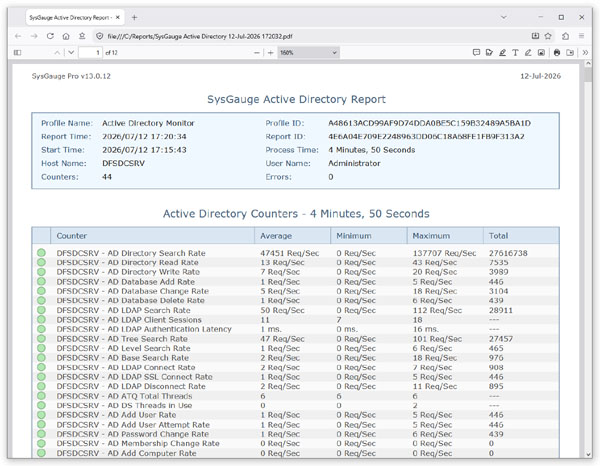
The report summary is followed by the monitoring counter list showing the counter status, counter name, average value, minimum value and the maximum
value for each counter in the report. In addition, if the report was saved in the ‘Compact’ or ‘Detailed’ report modes, the report will include
a line chart for each monitoring counter included in the report. Finally, if the report was saved in the ‘Detailed’ report mode, the report will
include the raw monitoring data for each monitoring counter included in the report.
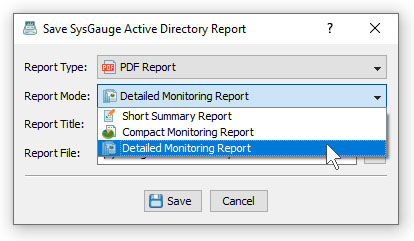
In order to select an appropriate Active Directory monitor report mode, use the 'Report Mode' selector located on the 'Save Report' dialog.
The report mode allows one to select how much information is exported to the Active Directory monitoring report and it is applicable
to the PDF, HTML, Excel, CSV, JSON, text and XML report formats.
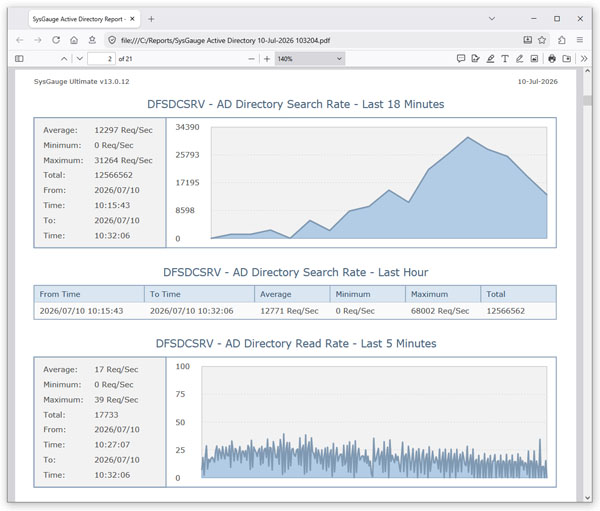
In the 'Short Summary Report' mode, the Active Directory report will include the report summary and the list of Active Directory monitoring counters.
In the 'Compact Monitoring Report' mode, the Active Directory report will include the report summary, the list of Active Directory monitoring counters
and a line chart for each monitoring counter included in the monitoring report. In the 'Detailed Monitoring Report' mode, the Active Directory report
will include the report summary, the list of Active Directory monitoring counters, a line chart for each monitoring counter and the raw monitoring
data for each monitoring counter included in the monitoring report.
SysGauge Server
SysGauge Server runs in the background as a Windows service and provides the user with the ability to monitor multiple DC servers via the network,
automatically analyze the status of the Active Directory services, save status reports and send E-Mail notifications when one or more critical
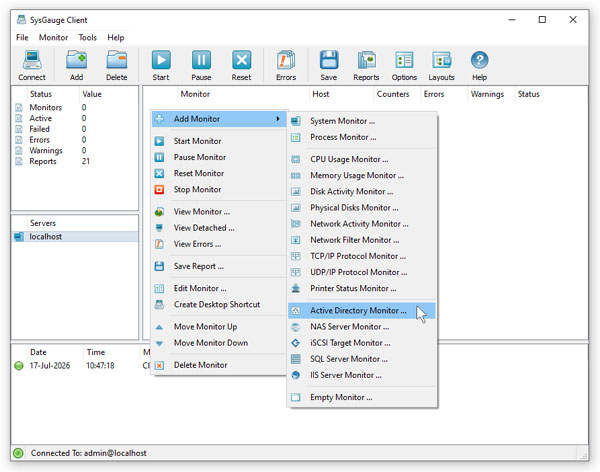
Active Directory issues are detected. In order to setup an Active Directory monitor, start the SysGauge Server GUI application, press the right
mouse button over the monitors view and select the 'Add - Active Directory Monitor' menu item.
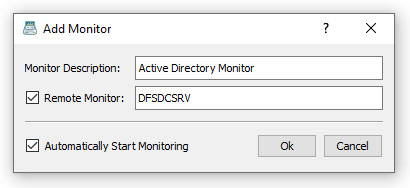
On the 'Add Monitor' dialog, specify a descriptive monitor name and select the 'Automatically Start Monitoring' option to automatically start
the monitor when the DC server is started. If the DC server should be monitored via the network, select the 'Remote Monitor' option and specify
the host name of the remote DC server. In addition, in order to enable the remote monitoring capabilities, the SysGauge service should be configured
to run under a user account which is a member of the ‘Performance Monitor Users’ group with permissions to access the remote DC server.
For example, if the user needs to monitor two DC servers via the network, a single SysGauge Server can be configured to monitor both DC servers using
the following monitors: a general purpose system monitor for all the standard system monitoring counters such as the CPU usage, memory usage,
disk activity, network activity, etc. for each remote DC server and a specialized Active Directory monitor for each server.
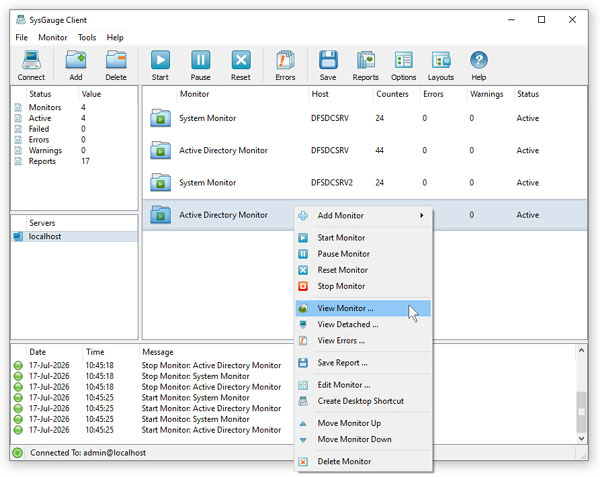
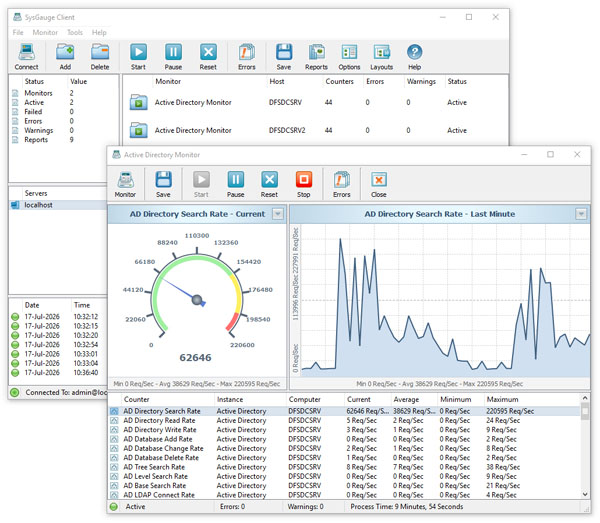
In order to open an Active Directory monitor, select the monitor item in the monitors view, press the right mouse button and select the 'View Monitor' menu
item. In order to open multiple monitors at the same time, select the 'View Detached' menu item and the SysGauge Server GUI application will open
the selected monitor in a separate application allowing one to display any number of monitors on multiple physical displays.
Comparing Active Directory Monitoring Reports
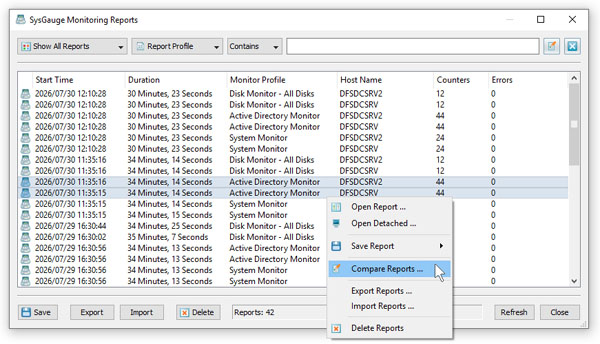
SysGauge Server provides the ability to compare Active Directory monitoring reports allowing one to easily identify critical changes between different
Active Directory servers and/or compare the current status of an Active Directory server with the previous status of the same server. In order to compare
two previously saved Active Directory monitoring reports, press the 'Reports' button located the main toolbar of the SysGauge Server GUI application,
select the required Active Directory monitoring reports, press the right mouse button and select the 'Compare Reports' menu item.
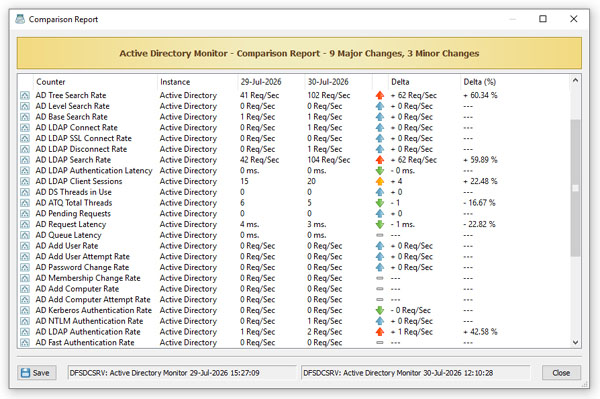
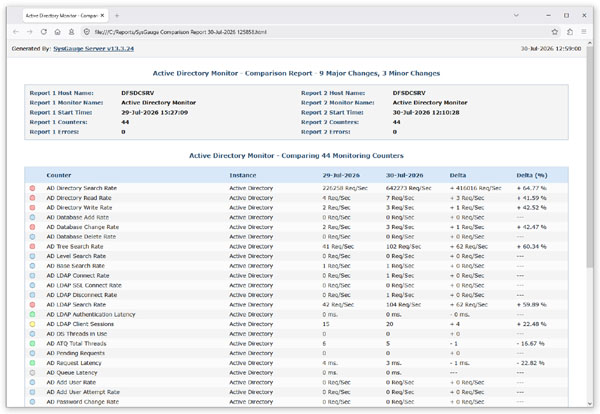
The top status pane of the Active Directory monitoring comparison dialog shows the number of major changes and the number of minor changes between
the compared monitoring reports. The middle view shows the list of Active Directory monitoring counters with average counter values from the compared
reports, an absolute value delta between the average values and a percentage delta between the average values for each Active Directory monitoring counter.
The user is provided with the ability to save the Active Directory comparison reports into a number of standard report formats including PDF, HTML, Excel,
CSV, text, JSON and XML. In order to save a comparison report, press the 'Save' button located in the bottom-left corner of the comparison dialog,
select an appropriate report format, select a destination directory, enter a report file and press the 'Save' button.
SysGauge Command Line Utility
In addition to the SysGauge GUI application, the user is provided with the ability to monitor the Active Directory services and save Active Directory
monitoring reports using the SysGauge command line utility, which is located in the SysGauge Pro and SysGauge Server installation directory.
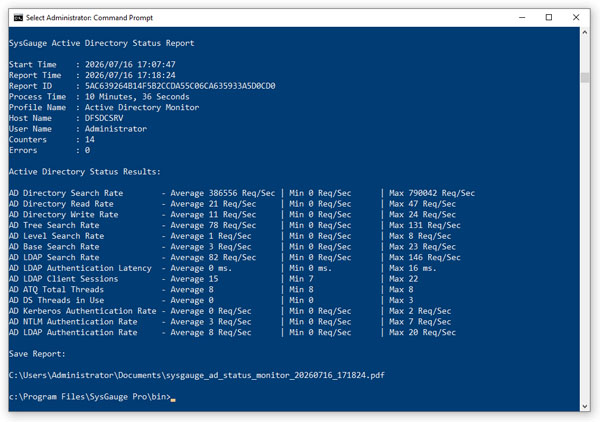
The command line utility provides the following Active Directory monitoring commands:
sysgauge –ad_status
This command executes an essential Active Directory monitoring operation and includes the most critical Active Directory performance, security and status counters.
sysgauge –ad_performance
This command executes an Active Directory performance monitoring operation and includes the Active Directory performance monitoring counters.
sysgauge –ad_security
This command executes an Active Directory security monitoring operation and includes the Active Directory security monitoring counters.
sysgauge –ad_replication
This command executes an Active Directory replication monitoring operation and includes the Active Directory DRA monitoring counters.
sysgauge –ad_monitor
This command executes an extended Active Directory monitoring operation and includes an extensive set of Active Directory performance, security, status and replication monitoring counters.
Command Line Options:
-host <Remote Host Name or IP address>
This option allows one to monitor a remote Active Directory server via the network.
-time <Monitoring Time in Seconds>
This command line option sets the maximum monitoring time in seconds, which is useful to automatically generate Active Directory status reports for specific time intervals.
-silent
This command line option enables silent operation, which is useful when saving reports.
-save_html_report <File Name or Directory>
This command line option saves an HTML Active Directory monitoring report.
-save_pdf_report <File Name or Directory>
This command line option saves a PDF Active Directory monitoring report.
-save_excel_report <File Name or Directory>
This command line option saves an Excel Active Directory monitoring report.
-save_text_report <File Name or Directory>
This command line option saves a text Active Directory monitoring report.
-save_csv_report <File Name or Directory>
This command line option saves a CSV Active Directory monitoring report.
-save_json_report <File Name or Directory>
This command line option saves a JSON Active Directory monitoring report.
-save_xml_report <File Name or Directory>
This command line option saves an XML Active Directory monitoring report.
-save_to_database <Table Name>
This command line option saves monitoring results to the specified SQL database table.
Active Directory Monitoring Counters
In addition to the dedicated SysGauge Active Directory monitor and the SysGauge command line utility, the user is provided with the ability
to create custom Active Directory monitoring profiles and/or add individual Active Directory monitoring counters to user-custom monitoring profiles.
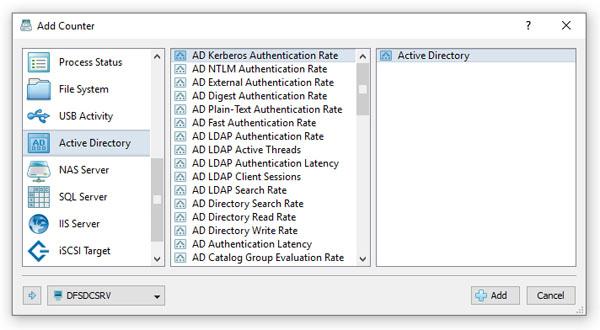
The default SysGauge Active Directory monitoring report includes the following Active Directory monitoring counters:
- AD Directory Search Rate – Measures the number of Active Directory search operations performed per second. Useful for evaluating overall directory query workload.
- AD Directory Read Rate – Measures the number of directory object read operations per second. Indicates how frequently clients retrieve object attributes.
- AD Directory Write Rate – Measures the number of directory write operations per second. Helps identify the rate of object modifications.
- AD Database Add Rate – Measures the number of new objects added to the Active Directory database per second.
- AD Database Change Rate – Measures the number of existing Active Directory objects modified per second.
- AD Database Delete Rate – Measures the number of Active Directory objects deleted per second.
- AD LDAP Search Rate – Measures the number of LDAP search requests processed per second. Useful for monitoring LDAP query activity.
- AD LDAP Client Sessions – Shows the number of currently active LDAP client connections to the domain controller.
- AD LDAP Authentication Latency – Measures the average time required to authenticate LDAP clients. Higher values may indicate authentication delays.
- AD Tree Search Rate – Measures the number of LDAP sub tree search operations per second, where the search traverses an entire sub tree beneath a base object.
- AD Level Search Rate – Measures the number of one-level LDAP search operations per second, where only immediate child objects are searched.
- AD Base Search Rate – Measures the number of LDAP base-object searches per second, where only a single object is queried.
- AD LDAP Connect Rate – Measures the rate of new LDAP client connections established per second.
- AD LDAP SSL Connect Rate – Measures the rate of secure (LDAPS) client connections established per second.
- AD LDAP Disconnect Rate – Measures the rate at which LDAP client sessions are disconnected.
- AD ATQ Total Threads – Shows the total number of Active Thread Queue (ATQ) worker threads available for processing LDAP and Active Directory requests.
- AD DS Threads in Use – Shows the number of Active Directory Domain Services worker threads currently processing requests. Useful for detecting thread exhaustion.
- AD Add User Rate – Measures the rate of successfully created user accounts.
- AD Add User Attempt Rate – Measures the total number of user creation attempts, including both successful and failed attempts.
- AD Password Change Rate – Measures the number of password change operations performed per second.
- AD Membership Change Rate – Measures the rate of changes to group memberships, including users being added to or removed from groups.
- AD Add Computer Rate – Measures the rate of successfully created computer accounts.
- AD Add Computer Attempt Rate – Measures the total number of computer account creation attempts.
- AD Kerberos Authentication Rate – Measures the number of Kerberos authentication requests processed per second.
- AD NTLM Authentication Rate – Measures the number of NTLM authentication requests processed per second.
- AD LDAP Authentication Rate – Measures the number of LDAP bind authentication requests processed per second.
- AD Fast Authentication Rate – Measures the rate of Fast Concurrent Bind (Fast Bind) authentication requests, which perform authentication without retrieving full user information.
- AD Plain-Text Authentication Rate – Measures the number of LDAP simple-bind authentication requests using plain-text credentials (typically protected by SSL/TLS).
- AD External Authentication Rate – Measures the rate of authentication requests delegated to external authentication providers or trusted domains.
- AD Authentication Latency – Measures the average time required to complete Active Directory authentication requests.
- AD Request Latency – Measures the average time required to process Active Directory client requests from receipt to completion.
- AD Queue Latency – Measures the average time requests spend waiting in the processing queue before execution.
- AD Pending Requests – Shows the number of client requests currently waiting to be processed.
- AD Enumeration Rate – Measures the rate of directory enumeration operations, such as listing users, groups, computers, or other directory objects.
- AD DRA Pending Requests – Shows the number of Active Directory replication requests currently waiting to be processed by the Directory Replication Agent (DRA).
- AD DRA Pending Operations – Shows the number of replication operations queued for execution.
- AD DRA Pending Syncs – Shows the number of replication synchronization operations waiting to start.
- AD DRA Sync Errors – Shows the number of replication synchronization errors detected by the Directory Replication Agent.
- AD DRA Inbound Transfer Rate – Measures the volume of replication data received from replication partners per second.
- AD DRA Outbound Transfer Rate – Measures the volume of replication data transmitted to replication partners per second.
- AD DRA Pending Inbound Updates – Shows the number of inbound replication updates waiting to be applied to the local Active Directory database.
- AD DRA Inbound Objects Applied – Measures the rate at which replicated directory objects are successfully applied to the local database.
- AD DRA Total Sync Requests – Shows the total number of replication synchronization requests received by the Directory Replication Agent.
- AD DRA Completed Sync Requests – Shows the total number of replication synchronization requests successfully completed.


