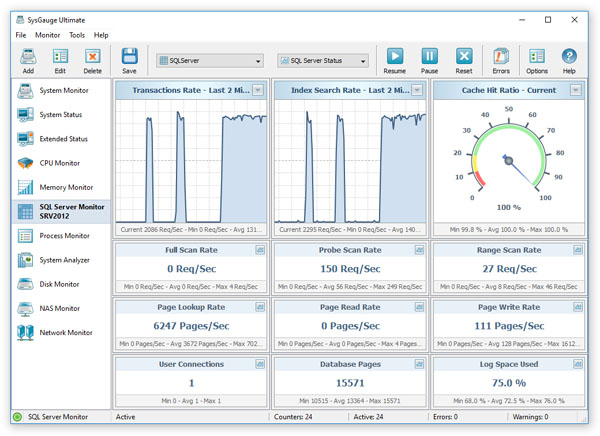
SysGauge Ultimate allows one to monitor one or more Microsoft SQL Servers locally of via the network. In order to add an SQL Server monitor
press the 'Add' button located in the top-left corner of the window and select the 'SQL Server Monitor' menu item. The SQL Server monitor
provides the ability to monitor the SQL index search rate, SQL transaction rate, SQL cache hit ratio, SQL full scan rate, SQL probe scan rate,
SQL range scan rate, SQL page lookup rate, SQL page read rate, SQL page write rate, SQL total memory, SQL database page count and the amount of used SQL log space.
The user is provided with the ability to save SQL server monitoring reports into a number of standard formats including HTML, PDF, Excel, CSV, text and XML.
In order to save an SQL server monitoring report, press the 'Save' button located on the main toolbar, select an appropriate report format,
enter a report title and press the 'Save' button.

For example, a PDF report includes the list of SQL server monitoring counters showing the average, minimum and maximum values for each counter and a number
of line charts showing how the performance of the monitored SQL server was changing over time.
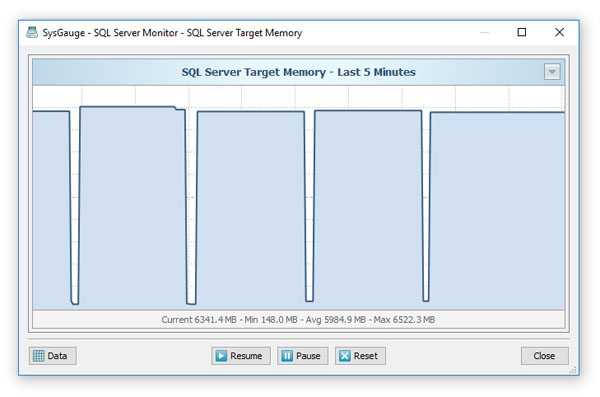
SQL Server Memory Monitor
The SysGauge SQL Server memory monitor GUI shows the SQL server total memory, the SQL Server cache memory, SQL Server target memory, SQL Server free memory,
SQL Server stolen memory, SQL Server lock memory, SQL Server log pool memory, SQL Server granted work space memory, SQL Server maximum work space memory,
SQL Server connection memory and the SQL Server optimizer memory.

In order to open the history chart dialog for a specific SQL Server monitoring counter, press the 'Chart' button located in the top-right corner of the required
counter. Under the history line chart, the history dialog shows the current counter value, the average counter value, the maximum counter value and the minimum
counter value. In addition, the history dialog allows one to show the monitoring history for the last 1, 2 or 5 minutes.
The history dialog provides the ability to export the monitoring data to a number of standard formats including HTML, PDF, Excel, text, CSV and XML. In order to
save the history monitoring data, press the 'Data' button located in the bottom-left corner of the history dialog, press the 'Save' button and select
an appropriate report format.
SQL Server Monitoring Counters
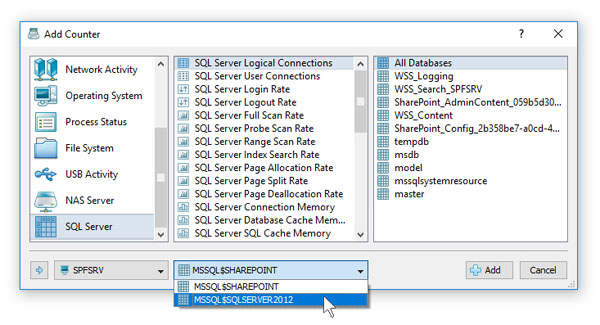
In addition to the dedicated SQL Server monitor, the user can use the customizable 'System Monitor' module to configure user-custom SQL Server monitoring profiles.
In order to add an SQL Server monitoring counter, press the 'Monitor' button located on the main toolbar, selected the 'SQL Server' counters category in the left-side
view and then select an appropriate SQL Server monitoring counter in the middle view. By default, SysGauge will monitor all SQL databases in the target SQL Server,
but if required, the user can select a specific SQL database to monitor in the right-side view. In addition, in order to monitor a remote SQL Server via the network,
press the 'Connect' button located in the bottom-left corner and specify the host name or an IP address of the remote computer to monitor.
- SQL Server Logical Connections - this counter monitors the number of currently active logical SQL server connections.
- SQL Server User Connections - this counter monitors the number of currently active SQL Server user connections.
- SQL Server Login Rate - this counter monitors the SQL Server login rate, which is displayed in logins per second.
- SQL Server Logout Rate - this counter monitors the SQL Server logout rate, which is displayed in logouts per second.
- SQL Server Full Scan Rate - this counter monitors the rate of SQL Server scan operations, which is displayed in scans per second.
- SQL Server Probe Scan Rate - this counter monitors the rate of SQL Server probe scan operations, which is displayed in scans per second.
- SQL Server Range Scan Rate - this counter monitors the rate of SQL Server range scan operations, which is displayed in scans per second.
- SQL Server Index Search Rate - this counter monitors the rate of SQL Server index search operations, which is displayed in searches per second.
- SQL Server Page Allocation Rate - this counter monitors the rate of SQL Server database page allocations, which is displayed in pages per second.
- SQL Server Page Split Rate - this counter monitors the rate of SQL Server database page split operations, which is displayed in pages per second.
- SQL Server Page Deallocation Rate - this counter monitors the rate of SQL Server database page deallocations, which is displayed in pages per second.
- SQL Server Connection Memory - this counter monitors the amount of SQL Server connection memory, which is displayed in MB.
- SQL Server Database Cache Memory - this counter monitors the amount of SQL Server database cache memory, which is displayed in MB.
- SQL Server SQL Cache Memory - this counter monitors the amount of SQL Server SQL cache memory, which is displayed in MB.
- SQL Server Lock Memory - this counter monitors the amount of SQL Server lock memory, which is displayed in MB.
- SQL Server Log Pool Memory - this counter monitors the amount of SQL Server log pool memory, which is displayed in MB.
- SQL Server Granted Workspace Memory - this counter monitors the amount of SQL Server granted workspace memory, which is displayed in MB.
- SQL Server Max Workspace Memory - this counter monitors the amount of SQL Server max workspace memory, which is displayed in MB.
- SQL Server Optimizer Memory - this counter monitors the amount of SQL Server optimizer memory, which is displayed in MB.
- SQL Server Free Memory - this counter monitors the amount of SQL Server free memory, which is displayed in MB.
- SQL Server Stolen Memory - this counter monitors the amount of SQL Server stolen memory, which is displayed in MB.
- SQL Server Target Memory - this counter monitors the amount of SQL Server target memory, which is displayed in MB.
- SQL Server Total Memory - this counter monitors the amount of SQL Server total memory, which is displayed in MB.
- SQL Server Background Write Rate - this counter monitors the SQL Server background write rate, which is displayed in pages per second.
- SQL Server Cache Hit Ratio - this counter monitors the SQL Server database cache hit ratio, which is displayed in percents.
- SQL Server Database Pages - this counter monitors the number of SQL Server database pages.
- SQL Server Page Lookup Rate - this counter monitors the rate of SQL Server database page lookup operations, which is displayed in pages per second.
- SQL Server Page Read Rate - this counter monitors the rate of SQL Server database page read operations, which is displayed in pages per second.
- SQL Server Page Write Rate - this counter monitors the rate of SQL Server database page write operations, which is displayed in pages per second.
- SQL Server Target Pages - this counter monitors the number of SQL Server target database pages.
- SQL Server Active Transactions - this counter monitors the number of currently active SQL Server transactions.
- SQL Server Data Files Size - this counter monitors the size of SQL Server data files, which is displayed in MB.
- SQL Server Log Space Used - this counter monitors the amount of used SQL Server log space, which is displayed in percents.
- SQL Server Transactions Rate - this counter monitors the rate of SQL Server transactions, which is displayed in transactions per second.
- SQL Server Write Transactions Rate - this counter monitors the rate of SQL Server write transactions, which is displayed in transactions per second.
SysGauge Command Line Utility
The SysGauge command line utility, which is available in SysGauge Ultimate and SysGauge Server product versions, provides the ability to monitor one or more SQL Servers and save SQL Server
monitoring reports from batch files and shell scripts. The command line utility is located in the SysGauge 'bin' directory and it can be used to monitor
the local system or remote servers via the network. In the simplest case, open a command prompt window, go to the SysGauge 'bin' directory and type the following command:
sysgauge -sql_monitor -save_pdf_report <File Name or Directory>
This command will perform an SQL Server monitoring operation using a number of SQL Server monitoring counters including the SQL Server transactions rate,
cache hit ratio, index search rate, full scan rate, probe scan rate, range scan rate, page lookup rate, page read rate, page write rate, database pages,
user connections, etc. In addition, after the monitoring operation will be completed, SysGauge will save a PDF SQL Server monitoring report to the specified file or directory.
Command Line Options:
-host <Remote Host Name or IP address>
This option allows one to monitor remote SQL servers via the network.
-sql_instance
Normally, the SQL Server monitor will try to connect to the default SQL Server instance. This command line option provides the ability to specify which SQL Server instance to monitor allowing one to monitor multiple SQL Server instances installed on the local computer or a number of remote computers via the network.
-time <Monitoring Time in Seconds>
This command line option sets the maximum monitoring time.
-silent
This option enables the silent operation mode.
-save_html_report <File Name or Directory>
This command line option saves an HTML SQL Server monitoring report.
-save_pdf_report <File Name or Directory>
This command line option saves a PDF SQL Server monitoring report.
-save_excel_report <File Name or Directory>
This command line option saves an Excel SQL Server monitoring report.
-save_text_report <File Name or Directory>
This command line option saves a text SQL Server monitoring report.
-save_csv_report <File Name or Directory>
This command line option saves a CSV SQL Server monitoring report.
-save_xml_report <File Name or Directory>
This command line option saves an XML SQL Server monitoring report.
-save_to_database <Table Name>
This command line option saves monitoring results to the specified SQL database table.