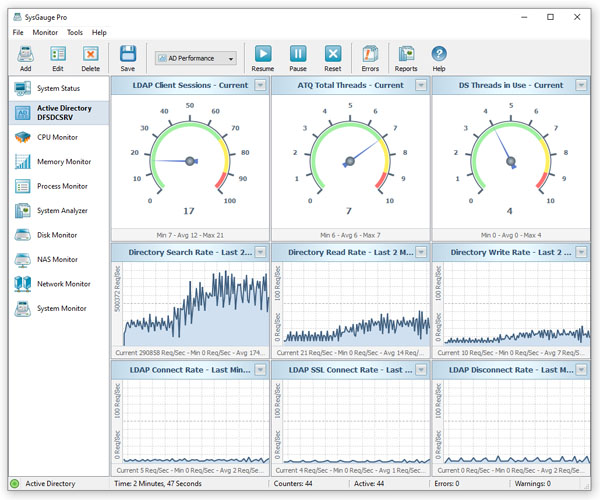
The 'System Status' GUI module shows the CPU usage, memory usage, the total number of running processes, the total number of running threads, the total number of system handles,
the amount of free system memory, the amount of used system memory, the size of the system cache, the disk transfer rate, the disk IOPS rate, the network transfer rate and the kernel CPU usage.
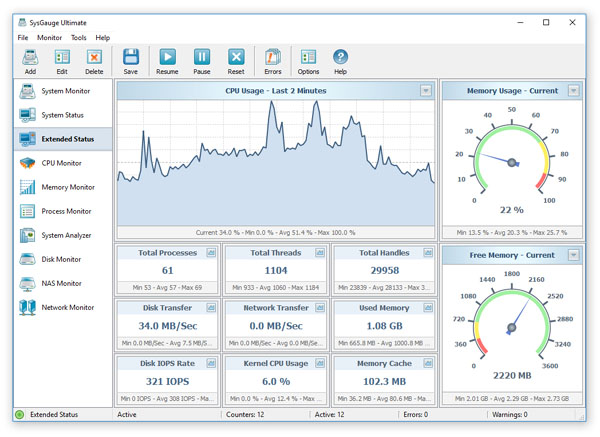
The CPU usage chart allows one to see the CPU usage for the last minute, last two minutes or last five minutes. The memory usage gauge allows one to see the current memory usage,
the average memory usage or the maximum memory usage. In addition, all monitoring counters display the minimum, maximum and average values on the counter's status bar.
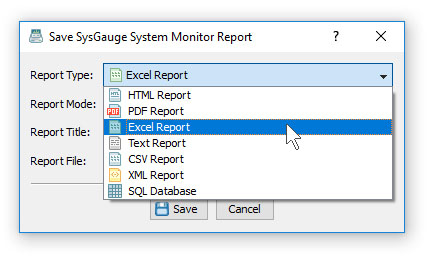
In addition, the user is provided with the ability to save system monitoring reports into a number of standard formats including HTML, PDF, Excel, text, CSV and XML. In order to
save a system monitoring report, press the 'Save' button located on the main toolbar, select an appropriate report format, enter a report file name and press the 'Save' button.
Resource Monitoring Per Process
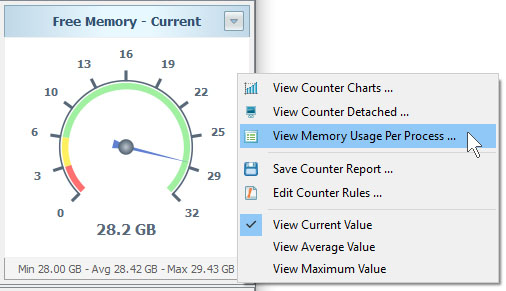
One of the most useful features of the SysGauge status monitor is to display the CPU usage per process, memory usage per process, data I/O rate per process, the number of threads
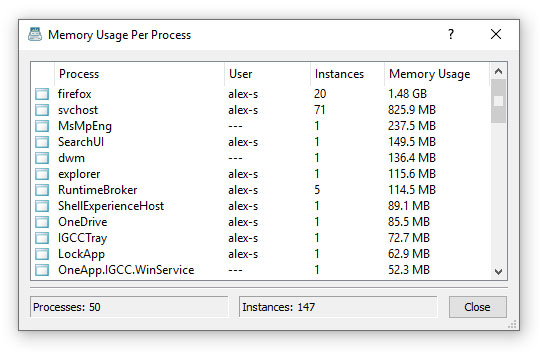
per process and the number of handles per process. For example, in order to display the memory usage per process, click the right mouse button over a memory usage counter and select
the 'Memory Usage Per Process' menu item.
The memory usage per process dialog shows the list of currently running processes sorted by the amount of the used system memory. For each process, SysGauge displays the process name,
the process user name, the number of processes instances and the combined memory usage for all process instances.
In order to see extended information about a process, double click on a process item in the process list. SysGauge will display the extended process information dialog showing the list
of all currently running process instances and allowing one to see detailed information about each process instance including the instance start time, process user name, executable
file name, executable file owner, file creation date, file modification date, executable file version information, etc.
System Monitoring Rules
The SysGauge system monitor provides the user with the ability to define conditional system monitoring rules allowing one to automatically detect excessive system resource usage
events and then play notification sounds, send E-Mail notifications or execute custom actions according to user-specified rules and policies.
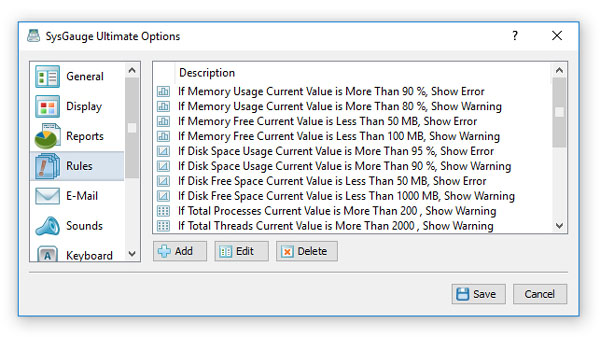
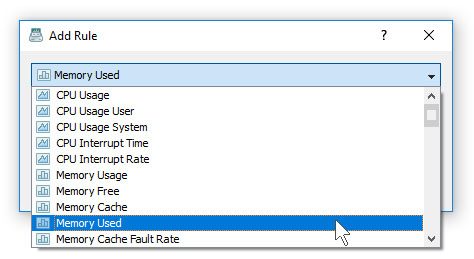
In order to add one or more system monitoring rules, open the 'Options' dialog, select the 'Rules' tab and press the 'Add' button. On the 'Add Rule' dialog select a system monitoring
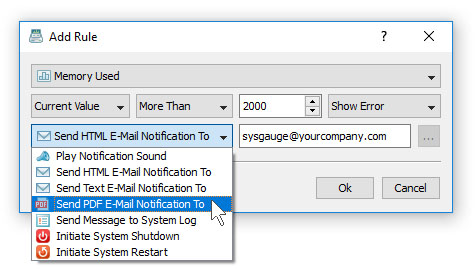
counter, specify a condition that should trigger the rule, select an action type and specify an action value if required.
For example, in order to send an E-Mail notification when the CPU usage rises above 90 percent, select the 'CPU Usage' counter type, set the rule condition to 'Current Value More Than 90',
select the 'E-Mail Notification' action type and enter an E-Mail address to send notifications to.
In addition, select the 'E-Mail' tab and specify an SMTP E-Mail server to use to send E-Mail notifications. During the system monitoring operation, SysGauge will check the selected
system monitoring counters and send E-Mail notifications when any of the selected system monitoring counters will rise above or drop below the user-specified limits.
SysGauge Command Line Utility
The SysGauge command line utility, which is available in SysGauge Ultimate and SysGauge Server product versions, provides the ability to monitor the system status and save system monitoring reports from batch
files and shell scripts. The command line utility is located in the SysGauge 'bin' directory and it can be used to monitor the local system or remote servers via the network.
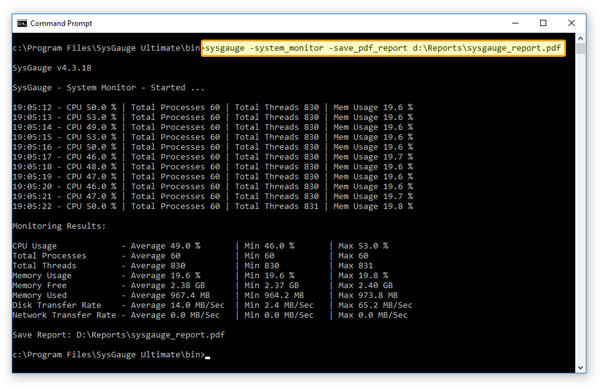
In the simplest case, open a command prompt window, go to the SysGauge 'bin' directory and type the following command:
sysgauge -system_monitor -save_pdf_report <File Name or Directory>
This command will perform a simple system monitoring operation using basic system monitoring counters including the CPU usage, the memory usage, the amount of free memory,
the amount of used memory, the total number of processes, the total number of threads, the disk transfer rate and the network transfer rate. In addition, after the monitoring
operation will be completed, SysGauge will save a PDF system monitoring report to the specified file or directory.
Command Line Options:
-extended
This command line option adds to the monitoring operation extended system monitoring counters including the system-level CPU usage, the total number of handles, the size of the memory cache and the disk transfer IOPS.
-host <Remote Host Name or IP address>
This command line option allows one to monitor remote servers via the network.
-time <Monitoring Time in Seconds>
This command line option sets the maximum monitoring time.
-silent
This command line option enables silent operation, which is useful when saving reports.
-save_html_report <File Name or Directory>
This command line option saves an HTML system monitoring report.
-save_pdf_report <File Name or Directory>
This command line option saves a PDF system monitoring report.
-save_excel_report <File Name or Directory>
This command line option saves an Excel system monitoring report.
-save_text_report <File Name or Directory>
This command line option saves a text system monitoring report.
-save_csv_report <File Name or Directory>
This command line option saves a CSV system monitoring report.
-save_xml_report <File Name or Directory>
This command line option saves an XML system monitoring report.
-save_to_database <Table Name>
This command line option saves monitoring results to the specified SQL database table.