Operating System Monitoring |
|
In order to add an operating system status counter, press the 'Add' button located on the main toolbar, selected the 'Operating System' counters category
in the left-side view and then select an appropriate operating system status counter in the middle view. In addition, in order to monitor the operating
system status in a remote computer via the network, press the 'Connect' button located in the bottom-left corner and specify the host name of the remote
computer to monitor.
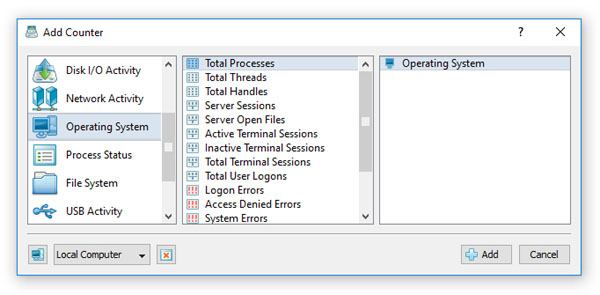
- Total Processes - this counter displays the total number of processes running in the computer at the time of data collection. Each running process represents a user application or a system program.
- Total Threads - this counter displays the total number of threads running in the computer at the time of data collection. A thread is the basic executable entity that can execute instructions in a processor.
- Server Sessions - this counter displays the number of server sessions in the computer at the time of data collection, which indicates the server activity.
- Server Open Files - this counter displays the number of files opened in the server at the time of data collection, which indicates the server activity.
- Terminal Sessions - this counter displays the number of active terminal sessions at the time of data collection.
- Total User Logons - this counter displays the total number of user logons since the last computer reboot including all interactive logons, network logons, service logons, successful logon and failed logons.
- Logon Errors - this counter displays the total number of failed logon attempts to the server, which can indicate whether password guessing programs are being used to crack the security on the server.
- Access Denied Errors - this counter displays the number of times file access operations failed with the 'Access Denied' error code, which can indicate whether somebody is randomly attempting to access files in hopes of getting at something that was not properly protected.
- System Errors - this counter displays the total number of times an internal server error was detected, which usually may indicate a problem with the server.
- Processor Queue Length - this counter displays the number of threads ready for execution at the time of data collection. Normally, a sustained processor queue of less than 10 threads per processor is acceptable, dependent of the workload.
- Context Switch Rate - this counter displays the combined rate at which all processors on the computer are switched from one thread to another, which is measured in thousands of switches per second. Context switches occur when a running thread voluntarily relinquishes the processor, is preempted by a higher priority ready thread or switches between the user mode and system execution mode.
- System Call Rate - this counter displays the combined rate of calls to the operating system service routines by all processes running on the computer, which is measured in thousands of calls per second. These operating system routines perform all of the basic scheduling and synchronization of activities on the computer and provide access to the memory management and disk I/O capabilities.
|
SysGauge News
|
13-Jul-2026
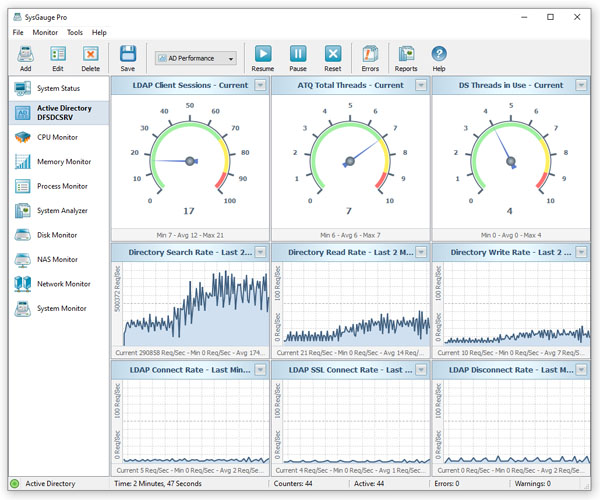
SysGauge v13.0 adds a dedicated Active Directory monitor allowing one to monitor the Active Directory performance, Active Directory health status, Active Directory security and Active Directory replication status. In addition, the new product version improves all types of system monitoring reports, improves the SysGauge Server product version and fixes a number of bugs.
|
|
4-Jun-2026
SysGauge v12.9 adds the process system CPU usage and the process user CPU usage counters to the process monitor, improves all types of process monitoring reports and improves the process comparison dialog. In addition, the new product version improves the process comparison reports, improves the SysGauge main GUI application and fixes a number of bugs.

|
More News
|
|


